Instacart Project Analysis
Objective:
Instacart is an online grocery store that operates through an app. The store already has good sales but is wanting to uncover more information regarding their sales patterns. As an analyst with Instacart, the task presented is to perform an initial data and exploratory analysis of some of the store’s data to derive insights and suggest strategies for better segmentation based on the provided criteria.
Context:
Instacart stakeholders are interested in the variety of customers in their database and their purchasing behaviors. It is assumed that not all customers can be targeted using the same methods and are considering a more customer targeting marketing strategy approach. Stakeholders wish to target different customers with applicable marketing campaigns to determine whether these customers influence product sales.
Key Questions:
What are the busiest days of the week and the busiest hours of the day?
Are there particular times of the day when customers spend the most money?
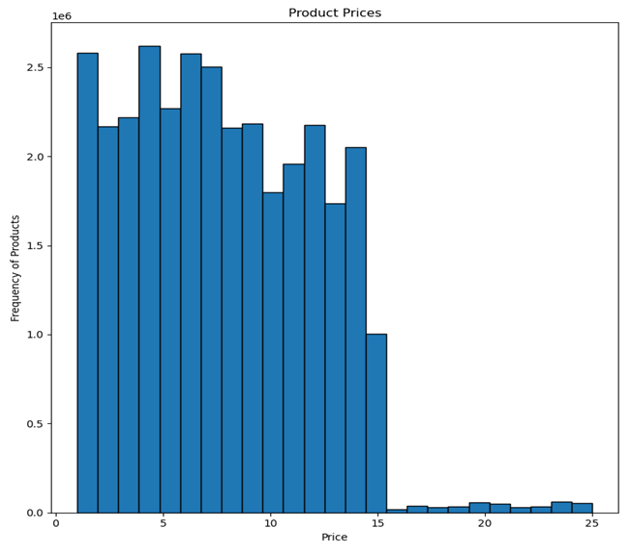
How can marketing and sales use simpler price groupings to help direct efforts?
Are there certain types of products more popular than others?
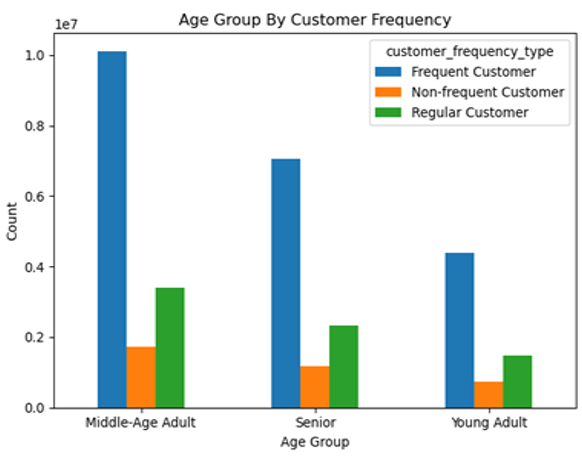
What are the differences in Instacart’s customer profiles and their ordering behaviors?
Project Tools:
Excel
Jupyter NoteBook
Anaconda
Python
Pandas
Matplotlib
Seaborn
Project Skills:
Importing/Exporting Libraries & Dataframes
Data Wrangling
Data Sub setting
Data Filtering
Data Merging
Data Consistency Check
Data Grouping & Aggregation
Deriving New Variables
Data Visualization
Project Process
Fist Stage- Cleaning Process
Process began with examining the original data regarding orders, products, departments, and customers. This process saw the removal of duplicate data, renaming columns, transposing data columns, changing data types, merging dataframes, and creating derivations. You will find examples of my code and work for this process below.
Second Stage- Aggregating data & Visual Creation Process
After the cleaning process, I begin aggregating and segmenting the cleaned data to begin getting my answers to the key questions of the project. This was done through the reviewing of the statistical data obtained, segmenting customer data into frequency of buying, and then the creation of relevant visualization graphs to accurately represent data findings within the cleaned data and the statistical data found.
Conclusion- Key Insights and Recommendation Analysis
Insight Analysis
Order Frequency Key Insights:
I focused on answering order frequency by the time of day, week , and hour. It was determined that order frequency occurred at its peak between 10am to 3pm and saw that Saturday and Sunday were the busiest times of the week with prices seeing their peak on Friday and Saturday.
Prices & Product Analysis Key Insights:
I started to focus on the visual representations of product pricing sales and their grouping, as well as department product sales. It was found that pricing categories mainly fall between the $5-$15 ranges and that mid-range priced products were the most common selling type, while produce products resulted in the highest selling department type.
Customer Segments Key Insights:
During the final dive into my findings, I focused on the customer aspect of the data. To best show comparisons, I focused on using bar and pie charts to visually represent the customer segment comparisons. The charts helped to identify that the company’s primary customer markets were those married of middle-age with middle-class income who showed to be regular customers rather than strong loyal standing customers.
Recommendations:
Schedule advertisements during off hours and the least busy days of the week and should run ads are during 12am-5am, while increasing ads on Tuesday and Wednesday.
Offer promotional ads for promotions or discounts during the early morning on slow days.
Advertise high-value products during peak hours to try and maximize sales.
Focus advertisements and sales efforts on mid-range products and prices.
Focus marketing and sales strategies on top 10 departments and incentive opportunities to poorly performing departments.
Increase engagement with regular customers through offered discount incentives.
Tailor main marketing efforts on middle-aged adults and middle-income customers.


