RockBuster Stealth Project Analysis
Objective:
RockBuster Stealth LLC is a global video rental company with stores worldwide. The objective of this project analysis aims to address a series of business questions from RockBuster Stealth Management Board. The project with use data analytics to provide insight for the company’s 2020 company strategy to transition to an online rental service.
Context:
RockBuster Stealth is facing stiff competition from competitor streaming services, such as Netflix and Amazon Prime. To stay competitive against the competition, the company plans to launch an online video rental service using its existing movie licenses.
Key Questions:
Which movies contributed the most/least to revenue gain?
What was the average rental duration for all videos?
Which countries are RockBuster customers based in?
Where are customers with a high lifetime value based?
Do sales figures vary between geographic regions?
Project Tools:
Excel
SQL
Tableau
Project Skills:
Relational Databases
Data Filtering
Data Cleaning & Summarizing
Database querying
Joining Tables
Subqueries
Common Table Expressions (CTE)
Project Process
Fist Stage- Cleaning Process
Process began examining the original data through descriptive statistical analysis of database tables and saw the removal of duplicate data, creating visual schema of the database, and creating key table guide of the database.
Second Stage- Querying data & Visual Creation Process
Using the cleaned data, the second stage saw the statistical data obtained and the cleaned data used to create queries and aggregate relevant data from the database and their tables to begin creating relevant visualization graphs to represent data findings to answer key questions of the project. Below are some examples of created queries and visuals from the project analysis.
Conclusion- Key Insights and Recommendation Analysis
Insight Analysis
Market Analysis Key Insights:
During this part of my analysis process, I focused on answering where the top and bottom countries or markets were located using a choropleth map of the top and bottom 10 countries with the most and least sales. It was determined that India, China, The United States, Japan, Mexico, Brazil, Russian Federation, Philippines, Turkey and Indonesia were the top performing markets. While, it was discovered that Ethiopia, New Zealand, Slovakia, Finland, Tunisia, Afghanistan, Saint Vincent and the Grenadines, Lithuania, and American Samoa were the least performing markets.
Movie Titles, Genre, & Ratings Analysis Key Insights:
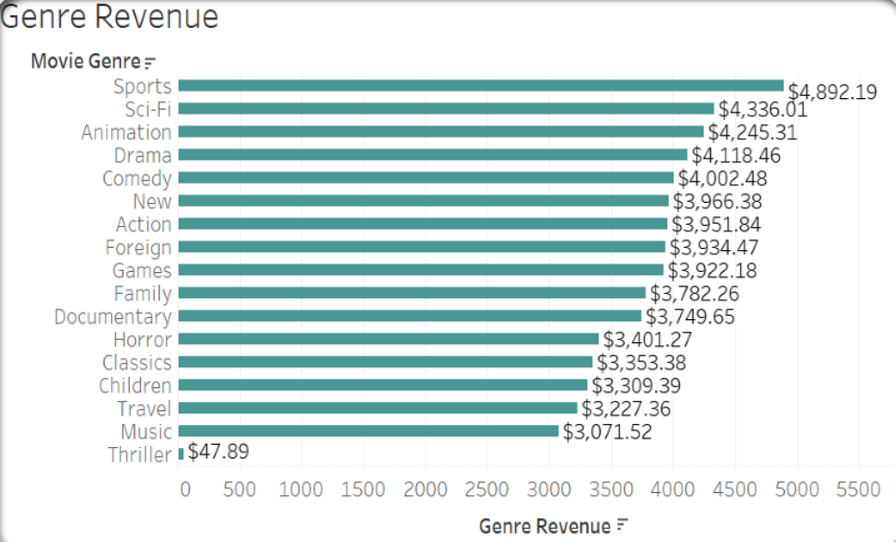
I focused this part of the analysis on answering the question pertaining to movie title sales, popular genres, and which ratings were preferred by customers to better understand customer renting behaviors and increase rental revenue by increasing preferred titles and genre preferences.
It was determined that Sports, Sci-Fi, Animation, Drama, and Comedy were the top rented genres, PG-13 and NC-17 were the most preferred ratings, and that the top 10 titles being Telegraph Voyage, Zorro Ark, Wife Turn, Innocent Usual, Hustler Party, Saturday Lambs, Titans Jerk, Harry Idaho, Torque Bound, and Dogma Family.
Recommendations:
Add movie genres based on country preferred preference to increase customer count and protentional revenue in top market countries..
To bring in new customers, advertise based on top performing genres matching country preference.
Stop efforts in the bottom performing markets and focus on more cost potential areas.
Increase movie inventory of sci-fi, drama, and comedy as they are lower than other top performing genres in terms of inventory.
Focus movies on PG-13, NC-17, PG, and R rated movies as customer base is believed to be of 13+ years of age.


